Vessel Replacement Design Proposal
Based on the research conducted for current technologies and designs on blood vessel replacements, particularly for the coronary artery, and the consideration on the criteria for design success, the category that yields the most optimal result is Tissue-Engineered Vascular Grafts (TEVG). Compared to the other categories researched (synthetic polymers, autologous vessels, and xenografts), TEVG allows for a precision approach to target mechanical and structural properties that can be designed to handle an arterial system’s native cardiac environment in high pressure with low permeability. Using stem cell technology such as a cell sheet-based approach, where adult stem cells are cultured and forming an allogeneic/autologous products, would ensure the highest degree of biocompatibility (low risk of rejection), a relatively lower risk of infection due to the similarity to the native tissues, and provide a comparable durability and growth and recovery rate for the patient. With this background information, the design that I proposed is a self-assembled (or scaffold-guided) in vitro tissue growth using cultured cells that are derived from adult stem cells that are specific to the coronary vasculature.
For this type of TEVG development, the key is in identifying the type of stem cell, Cardiac Stem Cells (CSC), that has the specific ability to develop into new blood vessels. Knowing that a pluripotent stem cell such as embryonic stem cells, that come from the inner cell mass of the blastocyst, can differentiate into various types of adult somatic cells, the goal for this design is to utilize adult stem cells (instead of embryonic approaches) to be harvested and cultured for the coronary artery replacement production, eliminating the controversy behind embryonic stem cell approaches. According to Chepeleva et. al’s publication Cell Therapy in the Treatment of Coronary Heart Disease, endothelial progenitor cells (EPC), found in bone marrow, has the potential to “directly contribute to blood vessel formation in recipient tissues and to stimulate angiogenesis through paracrine signaling.” (Chepeleva et. al, Int J Mol Sci) The key to this project is either to find a biodegradable scaffold where the cultured EPC can be seeded and develop into a cylindrical replacement artery, or, according to Saito et. al in Challenges and Possibilities of Cell-Based Tissue-Engineered Vascular Grafts to create an environment in which the EPC culture is able to grow into a sheet of in vitro grown tissue (i.e. with chemical treatments such as ascorbic acid or hydrostatic pressure) that can be wrapped around a mandrel, allowing the layers to fuse and form into a tube shaped vessel. (Junichi Saito et. al., SPJ) In the case of a biodegradable scaffold, natural materials like extracellular matrix proteins will be used to allow natural cell attachment and the storage and release of growth factors. This approach provides a fully biocompatible scaffold that would be optimally integrated.
Materials Needed for Design
For the material used in the proposed TEVG design tissue, various factors must be considered for it to be the most optimal replacement product/technique, including the mechanical properties such as ultimate tensile strength (UTS) and the Young’s modulus of the chosen material, its biocompatibility, ensuring low rejection rates with replacement materials being well-received in the body and its integration with the native tissue, as well as physical properties such as surface roughness, porosity, and degradation rate that ensures proper cell attachment and that the scaffold will break down in a timely manner.
ULTIMATE TENSILE STRENGTH (UTS) AND YOUNG’S MODULUS
The ultimate tensile strength (UTS) is the amount of stress a material can withstand before failure. In implanted material, the UTS must be substantially below this point. Therefore, the created material should be designed to have a higher tensile strength tolerance. According to – the optimal UTS of , but particularly for coronary arteries is -. According to Claes et. al in The Mechanical Properties of Human Coronary Arteries, the circumferential tensile strength of an aorta is around 1.63+/-4 MPa for patients of age 66+/- 3 years. It also states that patients around 51+/-6 years have a higher level at 1.80+/- 0.24 MPa. This indicates that UTS decreases as a person ages. (Clases et. al, 2010) The chart below shows the conducted research on the tensile strength versus age. (*disclaimer: the figure below is the coronary vessels, not the aorta itself, hence the numbers are lower, but represent this relationship.) With this data, the targeted UTS of the replacement material should be designed similar to that of a 20-year-old patient, who has a higher UTS by a factor of 3. Furthermore, since the design should hold an even higher tolerance, the UTS should have a 200-300% buffer, bringing it to around 9-13.5 MPa.
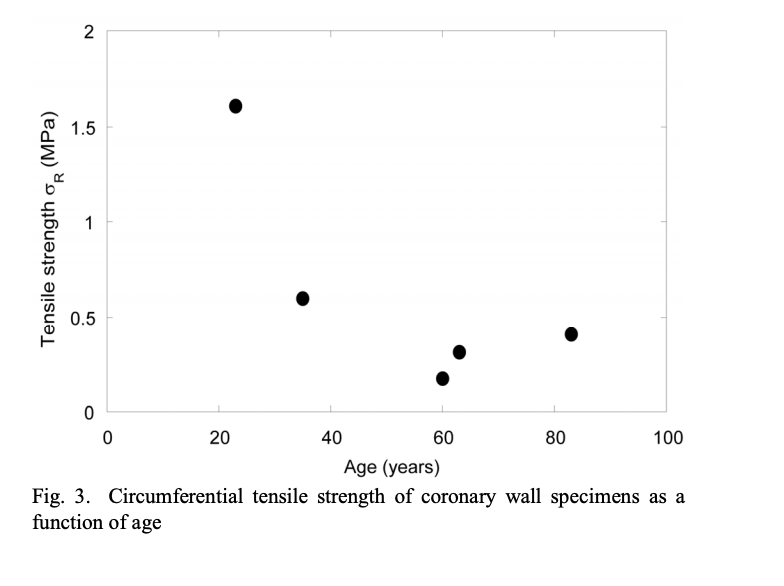
Figure 1: Graph of the Circumferential Tensile Strength of the coronary wall depending on age. (Claes et. al,)
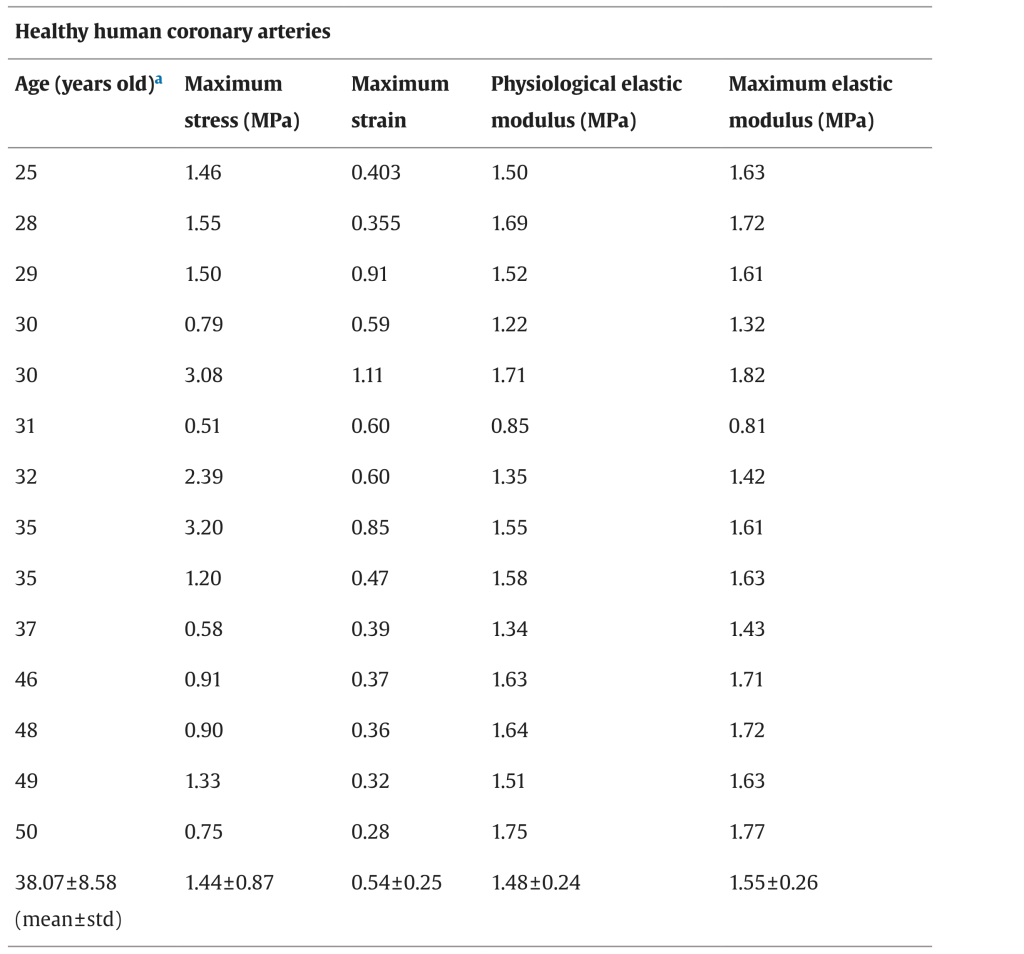
The Young’s Modulus, or Modulus of Elasticity, is the elasticity of a material. The higher the value, the less elastic the material. According to a table from Karimi et. al’s Measurement of the Uniaxial Mechanical Properties of Healthy and Atherosclerotic Human Coronary Arteries, the E value of a coronary artery from a patient of 50+ years of age is around 1.75 MPa comparing to the E value of a coronary artery from a 25-year-old patient’s, whose is at 1.50 MPa, it is proven that the Modulus of Elasticity value goes up as a person ages (meaning the coronary artery becomes less elastic). (Karimi et. al, 2013) The replacement vessel should be very similar to the original artery’s value, given its existing yield, therefore the design target for Young’s Modulus is set at 1.75 Mpa.
Figure 2: A chart of the average Maximum Elastic Modulus for each age. (Karimi et. al, Science Direct)
For any proposed design, the UTS of 9-13.3 MPa and an E value of 1.75 MPa should be used as a target value in the chosen material. Traditional synthetic polymers used for the cardiovascular purpose such as Polyethylene Terephthalate (PET) has a UTS of 22.0 MPa and an E value of 1.57-5.2 GPa, and Polyurethane (PU) had a UTS of 20.4 MPa and an E value of 27.19 MPa (Lim et. al, Application of High-Strength Biodegradable Polyurethanes Containing Different Ratios of Biobased Isomannide and Poly (E-caprolactone) Diol.) For our proposed design, the ultimate product is a 100% allogeneic/autologous product that is regenerated by the patient’s own stem cells, therefore, the vessel tissue being produced would have a similar UTS and E value compared to the native tissue. Compared to traditional synthetic materials, this TEVG product will be highly similar in matching the original mechanical properties. In particular, the E value of the replacement tissue is controlled by the extracellular matrix (ECM) component of elastins and smooth muscle cells (SMC), which gives elasticity to the cells and blood vessel tissues, while SMC regulates the stretch and hydrostatic pressure. (Junichi Saito et. al., SPJ)
BIOCOMPATIBILITY
The main factors relating to biocompatibility include risk of infection, risk of rejection, growth and recovery, and durability. In the designed TEVG replacement product, endothelial cells (EC) will be designed to attach to the intima, or interior wall, of the vessel. ECs play a major role in fighting bacterial and viral invasions and resist bacterial attachment, ultimately improving the graft patency and lowers the risk of infection after implantation. While collagen is a protein that helps structure the blood vessel wall, fibroblasts react to their surrounding environment and produce this ECM protein that also prevents vascular rupture at high blood pressures and stimulates the transformation of various growth factors. Furthermore, mesenchymal stem cells (MSC) are introduced to allow for high regenerative ability and immunoregulatory features. (Junichi Saito et. al., SPJ)
Another ECM component, proteoglycans, has a net negative charge that attracts water molecules, keeping the tissue hydrated and trap molecules such as growth factors that enhance recovery. Since our design is an autologous blood vessel product, it possesses physiological property closest to the patient’s vasculature that is being replaced, providing the optimal biocompatibility scenario.
MODIFICATIONS AND INTEGRATION
Modifications are found in many replacement materials, such as PLGA and PU, to mimic the surface roughness and porosity of the native tissue in order to enhance the cell attachment in growth and recovery, enhance scaffold material degradation, and allow for faster cellular infiltration into the scaffold. Research has shown that cell attachment is more optimal on nano-structured as opposed to micron structured surfaces, where these synthetic polymers will be chemically treated to create a nano-structured surface and a high degree, in the range of 75-80%, of porosity. Traditional synthetic materials are practically inert after implantation as it is more preferable to have a biocompatible and non-degradable material rather than to have a degradable material that releases toxic byproducts as it degrades.
For the TEVG product, modification will likely be unnecessary as the in vitro grown cell-sheet will be cultured to develop into tissues matching exactly the properties of the native tissues. This is achieved by the introduction of ECM proteins such as laminin, a protein that forms a network of weblike structures that helps in both tensile loads and cell adhesion, fibronectin, a protein that connects cells with collagen fibers in the ECM and forms dimers that follow their secretion, and collagen, which supports the structural component to cells and tissues. Based on these natural components, the replacement product will be integrated with the surrounding tissue in a natural fashion. (Junichi Saito et. al., SPJ)
POTENTIAL COMPLICATIONS
Potential complications of traditional, synthetic replacement materials would likely be found in areas of resistance to infection, rejection rates, and in the integration with natural tissues surrounding, although these products tend to excel in durability and availability. The proposed design of an allogeneic/autologous TEVG blood vessel would have ultimately solved these complications, however “more research is needed to achieve the most feasible methods for generating optimal TEVGs.” Currently, TEVG technologies involving somatic and stem cells are in an advanced research phase, but according to Saito et. al’s Challenges and Possibilities of Cell-Based Tissue-Engineered Vascular Grafts, before TEVG is able to be applied in clinical settings, improvement in many areas is required, such as the feasibility of obtaining cells, time and cost needed for creation, and “patency and non thrombogenicity,” and a long term influence of the TEVG implants need to be assessed. (Junichi Saito et. al., SPJ)
Calculations – Vessel Geometry and Fluid Dynamics
CROSS SECTIONAL AREA AND LENGTH OF CORONARY ARTERY
Research result found in NIH’s article on Cross-Sectional Area Measurement of the Coronary Arteries Using CT Angiography at the Level of the Bifurcation consists of three major categories of arteries studied for their dimensions, namely: Left Main Coronary Artery (LMCA), Left Anterior Descending Artery (LAD) an circumflex artery (CX). The cross-sectional areas between the three are in descending order with LMCA being largest, giving its function, LAD being the second largest, and CX being last. For Sally’s procedure, we are interested in the dimensions of LMCA to be the replacement target. According to the research, LMCA is approximately 15.9+/- 3.9 mm2 in women and 18.1+/-3.6 mm2 in men, reporting that the cross-section of LMCA was found larger in men. The same article also reported that there is no significant correlation found between coronary artery cross-sectional areas and the patient’s age. (Verim et. a, DIR)
According to The British Heart Journal’s Length of Left Main Coronary Artery, where 100 coronary cineangiograms were conducted, the length of the LMCA ranges from 1-24+ mm with the majority found at around 7-12mm. (note: the research is not specific in terms of age and gender) (Fox, et. al, British Heart Journal) According to an Openheart article on Comparison of Cardiac CT Angiography Coronary Artery Dimensions and Ethnicity in Trinidad, the mean length of the LMCA of a female is 4.109 mm while it is slightly higher for men at 4.428 mm. This research was conducted across different ethnicities, therefore providing a general view of the lengths for LMCA between genders. (Welch, et. al, Openheart). With these pieces of information, the targeted length to be analyzed in this calculation is set at the lower value of the normal range to reflect Sally’s case at 7-8 mm.
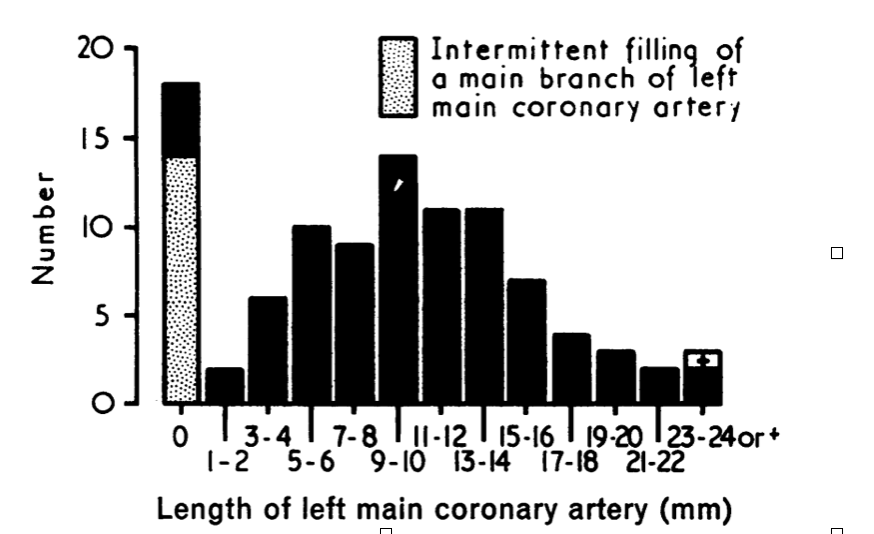
Figure 3: Length of left main coronary artery in 100 coronary angiograms (Fox, et. al, British Heart Journal)
REPLACEMENT VESSELS RADIUS AND DIAMETER
Assuming a circular cross section, the radius is found with the area of a circle given its cross sectional area of 15.9 mm2.
Area of a circle = πr2
15.9 mm2 = πr2 therefore, r2 = 5.064 mm2 and r = 2.25 mm
The radius of the design vessel should be around 2.25 mm and the diameter should be around 4.50 mm.
RELATIONSHIP BETWEEN FLOW RATE AND PRESSURE GRADIENTS
With the Pousielle’s equation for fluid dynamics, the given equation below shows the relationship between flow rate and change of pressure. The poiseuille’s equation is assuming that the fluid flows through a long cylindrical pipe, the shape similar to a blood vessel.

Since we are trying to establish a relationship between Q (flow rate in m3/s) and the change of P (pressure N/m2 or Pa) given a certain radius and length of a cylindrical pipe, we have to identify the viscosity of blood at 37º C, resembling the normal body temperature. According to the chart found in Okaharam et. al, in the article Online Prediction of Normal Blood Viscosity During Cardiopulmonary Bypass Using Hematocrit- and Temperature Dependent Model, such viscosity is also dependent on hematocrit level of the patient. (Okara et. al. IEEE) With the normal blood hematocrit at between 36-48% for women according to NIH, and referencing Anton Paar’s chart from their article Viscosity of Whole Blood, the viscosity for blood at 37º C is around 2.78 mPa.s (or 2.78 kg/ms) (dynamic viscosity) and 2.65 mPa.s (kinetic viscosity). (Anton Paar, Viscosity of Whole Blood)
To check the units:
Q (m3/s) = [∆P (kg/ms2) • π (unitless) • r4 (m4)] / [8(unitless) • L (m) • n (kg/ms)]
Q (m3/s) = (kgm4/ms2) / (kgm/ms)
Q (m3/s) = (kgm3/s2) / (kg/s)
Q (m3/s) = m3/s
CALCULATIONS
Q = (∆P • π • r4) / (8 • L • n)
Q = (∆P • π • 0.002254) / (8 • 0.0075 • 2.78)
Q = 8.047 • 10-11 ∆P / 0.1668
Q = 7.357 • 10-10 ∆P
Therefore, the constant in the relationship between the flow rate and change of pressure gradient in a replacement blood vessel with a radius of 2.25 mm and a length of 7.5 mm in a normal body temperature of 37º C is 7.357 • 10-10.
POISEUILLE’S EQUATION AND GRAPH
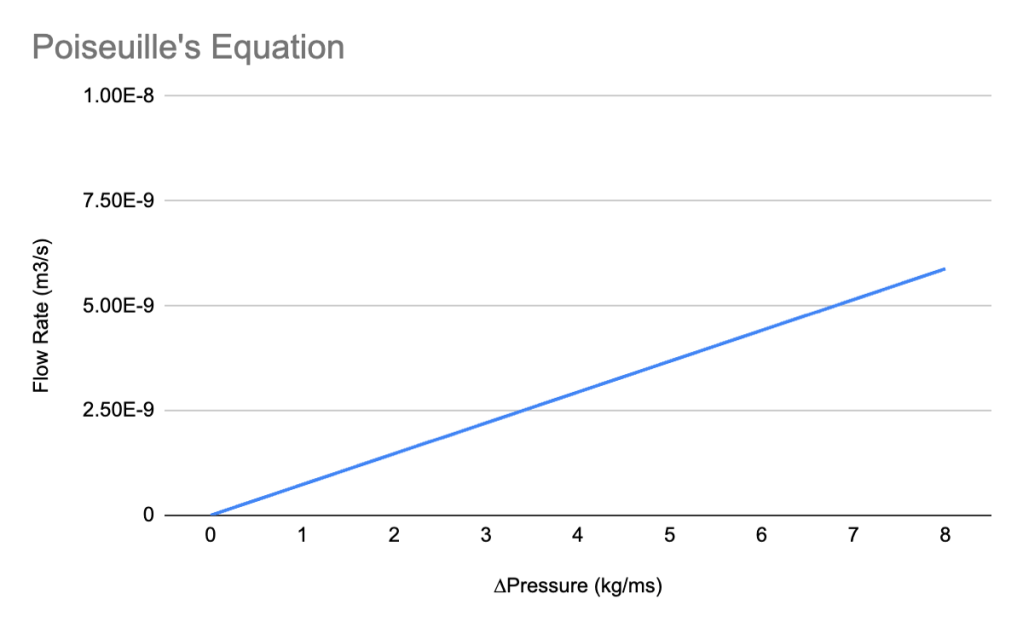
The Poiseuille’s equation, with a fixed constant, yields a straight line with the constant being the slope of the graph. The slope, represented by the change of flow rate over the change of pressure. For every 1 kg/ms change in pressure, there is a 7.357×10⁻¹⁰ m3/s change in flow rate. Another conventional unit for flow rate of blood is in L/m (liters per minute), (1 m3/s = 60,000 liters per minute), the chart below shows the same relationship in these units, however, this refers to what the entire heart pumps out into the body, not in the same cylindrical tube structure that is used for the blood vessel replacement.
DESIGN SPECIFICATION
According to Barral et. al’s Homeostasis of the Cardiovascular System, the blood flow in coronary arteries varies from 70-80 mL/min to as much as 300-400 mL/min for 100g of tissue depending on activity in which the person is participating in. For the design standard for a replacement tissue, it should be designed with tolerance, therefore targeting a blood vessel that can hold up to 500 mL/min, or 0.5 L/min. The chart below shows a modification of the original chart above, with the flow rate converted to L/mins. (Barral et. al, Visceral Vascular Manipulations)
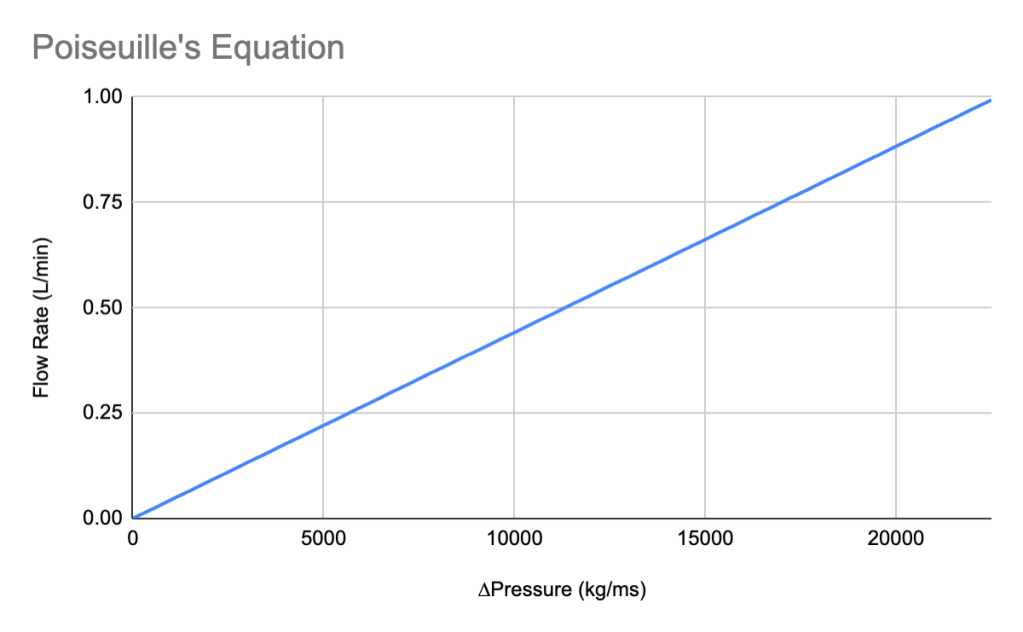
From the chart above, design specification will target the pressure gradient as identified at 11,000 kg/ms with a given flow rate of 0.5 L/min, which is the design specification we should use in creating a blood vessel replacement product.
References
Elena V. Chepeleva et. al, Cell Therapy in the Treatment of Coronary Heart Disease. Int J Mol Sci. https://www.ncbi.nlm.nih.gov/pmc/articles/PMC10706847/ November 28, 2023
Junichi Saito et. al., Challenges and Possibilities of Cell-Based Tissue-Engineered Vascular Grafts. SPJ https://spj.science.org/doi/10.34133/2021/1532103February 2021
E. Claes et. al. Mechanical Properties of Human Coronary Arteries, https://oa.upm.es/9081/1/INVE_MEM_2010_84406.pdf. 2010
Karimi et. al, Measurement of the Uniaxial Mechanical Properties of Healthy and Atherosclerotic Human Coronary Arteries. https://www.sciencedirect.com/science/article/pii/S0928493113001161?via%3Dihub July 1, 2013
Lim et. al, Application of High-Strength Biodegradable Polyurethanes Containing Different Ratios of Biobased Isomannide and Poly (E-caprolactone) Diol. NIH https://pubmed.ncbi.nlm.nih.gov/25076809/ May 2013
Samet Verim et. al, Cross-Sectional Area Measurement of the Coronary Arteries Using CT Angiography at the Level of the Bifurcation: is there a relationship?, https://www.ncbi.nlm.nih.gov/pmc/articles/PMC4622391/pdf/dir-21-6-454.pdf. 2015
Fox et. al ,Cardiac Department, St. Thomas’ Hospital and Pathology Department, St. George’s Hospital, Length of left main coronary artery. https://www.ncbi.nlm.nih.gov/pmc/articles/PMC458705/pdf/brheartj00282-0022.pdf. 1973
Shigeyuki Okahara et. al. Online Prediction of Normal Blood Viscosity During Cardiopulmonary Bypass Using Hematocrit- and Temperature Dependent Model. IEEE Access https://ieeexplore.ieee.org/stamp/stamp.jsp?tp=&arnumber=8946596 December 2019
Jean-Pierre Barral et. al, Homeostasis of the Cardiovascular System, Visceral Vascular Manipulations:https://www.sciencedirect.com/topics/nursing-and-health-professions/coronary-artery-blood-flow#:~:text=Coronary%20blood%20flow%20is%20subject,100%20g%20tissue%20on%20exertion. 2011
FIGURES:
Figure 1: E. Claes et. al. Mechanical Properties of Human Coronary Arteries, https://oa.upm.es/9081/1/INVE_MEM_2010_84406.pdf. 2010
Figure 2: Karimi et. al, Measurement of the Uniaxial Mechanical Properties of Healthy and Atherosclerotic Human Coronary Arteries. https://www.sciencedirect.com/science/article/pii/S0928493113001161?via%3Dihub July 1, 2013
Figure 3: Fox et. al ,Cardiac Department, St. Thomas’ Hospital and Pathology Department, St. George’s Hospital, Length of left main coronary artery. https://www.ncbi.nlm.nih.gov/pmc/articles/PMC458705/pdf/brheartj00282-0022.pdf. 1973

Leave a comment